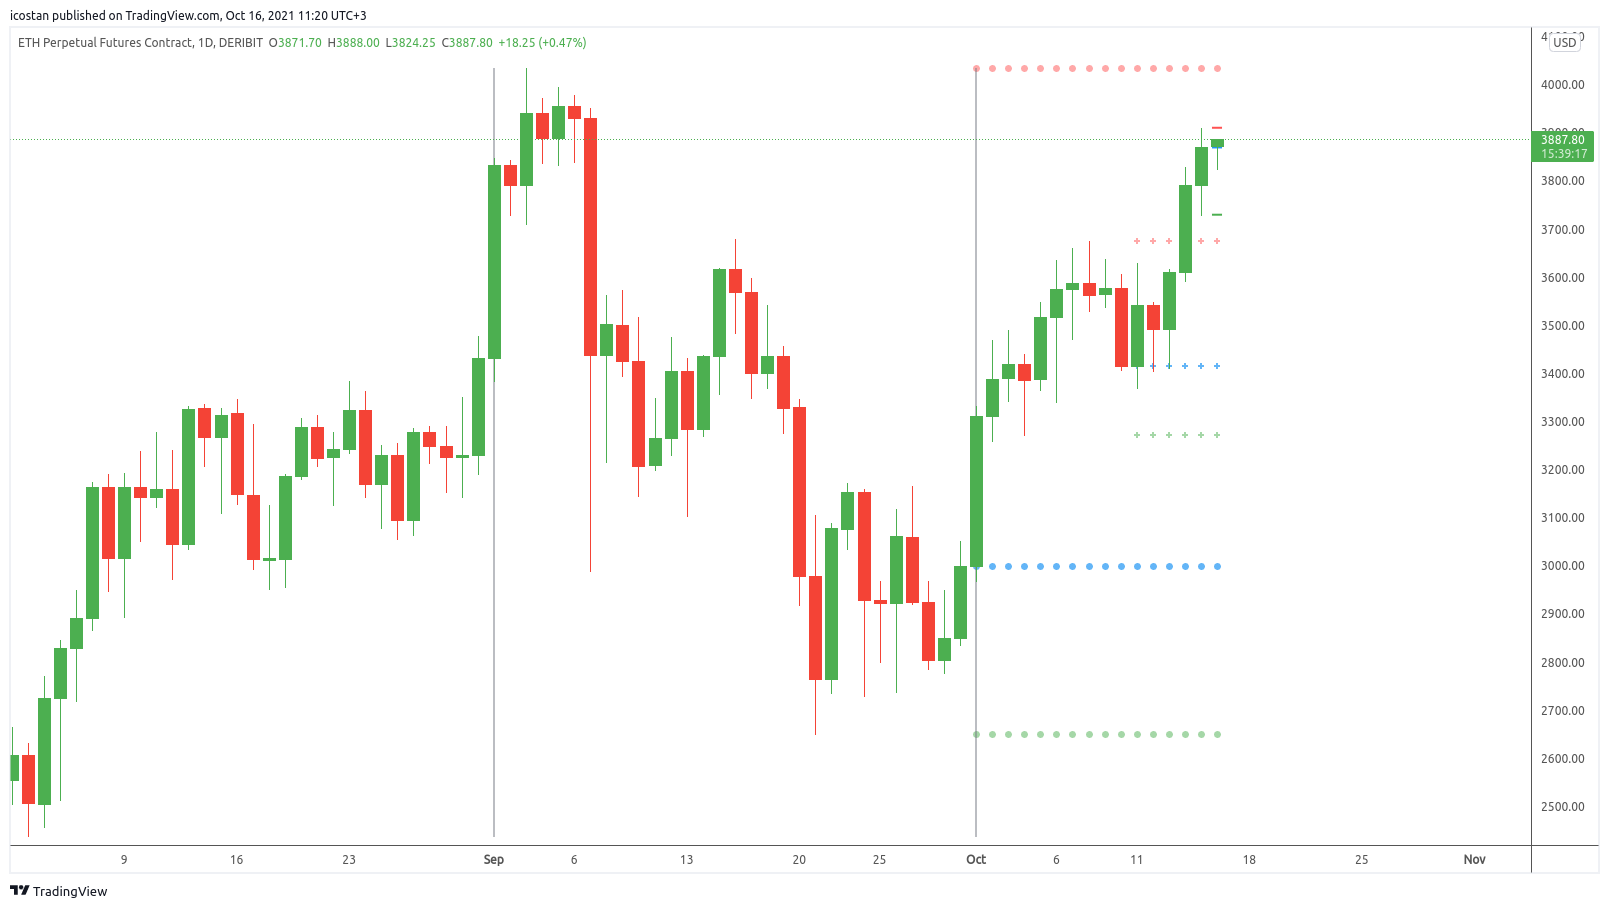
Maybe one of the most effective indicator that I use on daily basis, Price breaks.
Again and again you can see how previous day/week/month's high/low and especially close act as support/resistance and how price bounces off these levels.
The shapes:
- month's high/low/close are marked with circles
- week's high/low/close marked with crosses
- day's high/low/close with lines
The colors:
- red - the highs
- green - the lows
- blue - the closes

Trade long and prosper!