I’ve decided to release a few personal indicators that I use in day by day trading and here is the first one: Weekly/Monthly close.
Here is the the source code if you want to dig more into it.
It’s a simple support/resistance indicator that overlays last week/month’s close price and can be configured in two modes:
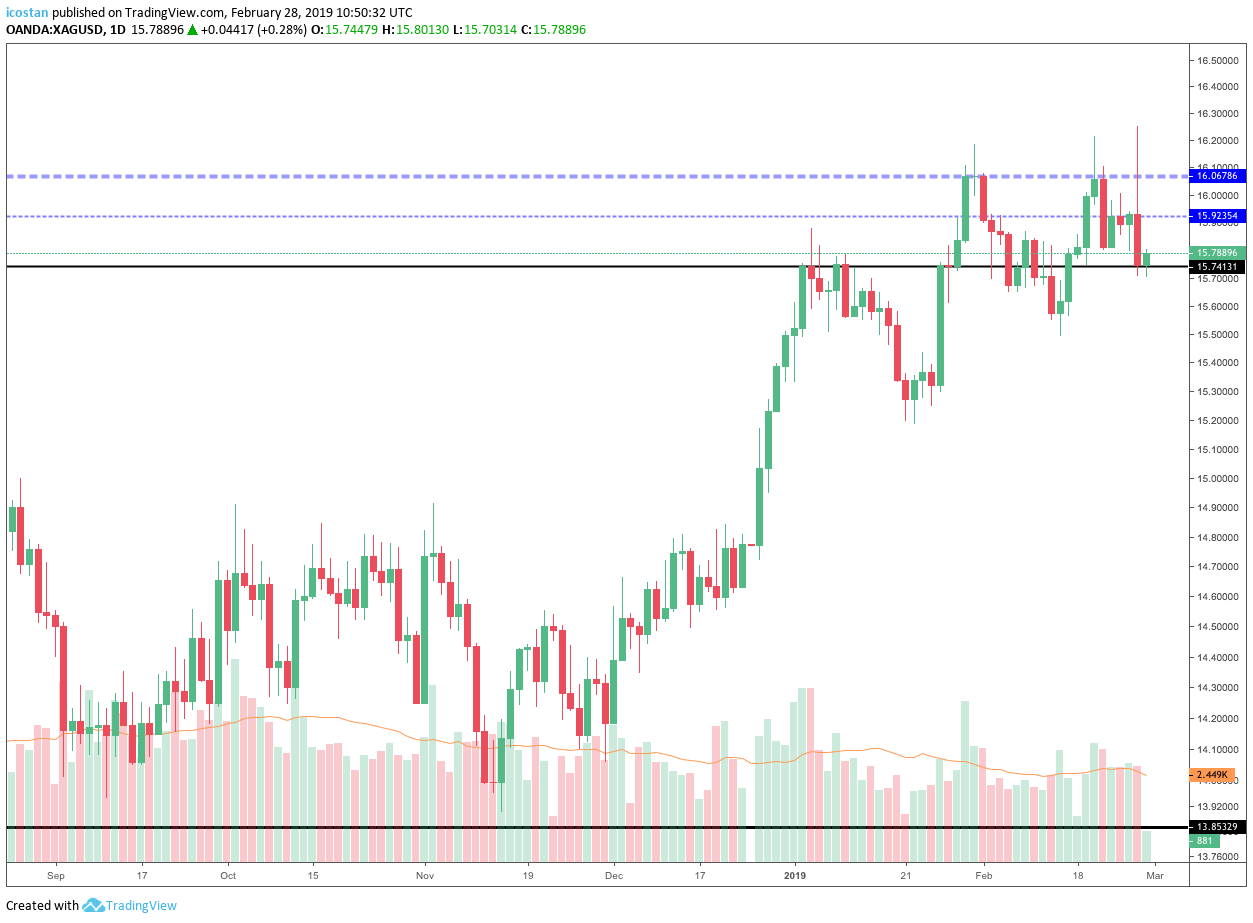
- tracking mode - to display last week/month’s close as a single price line (1st image)
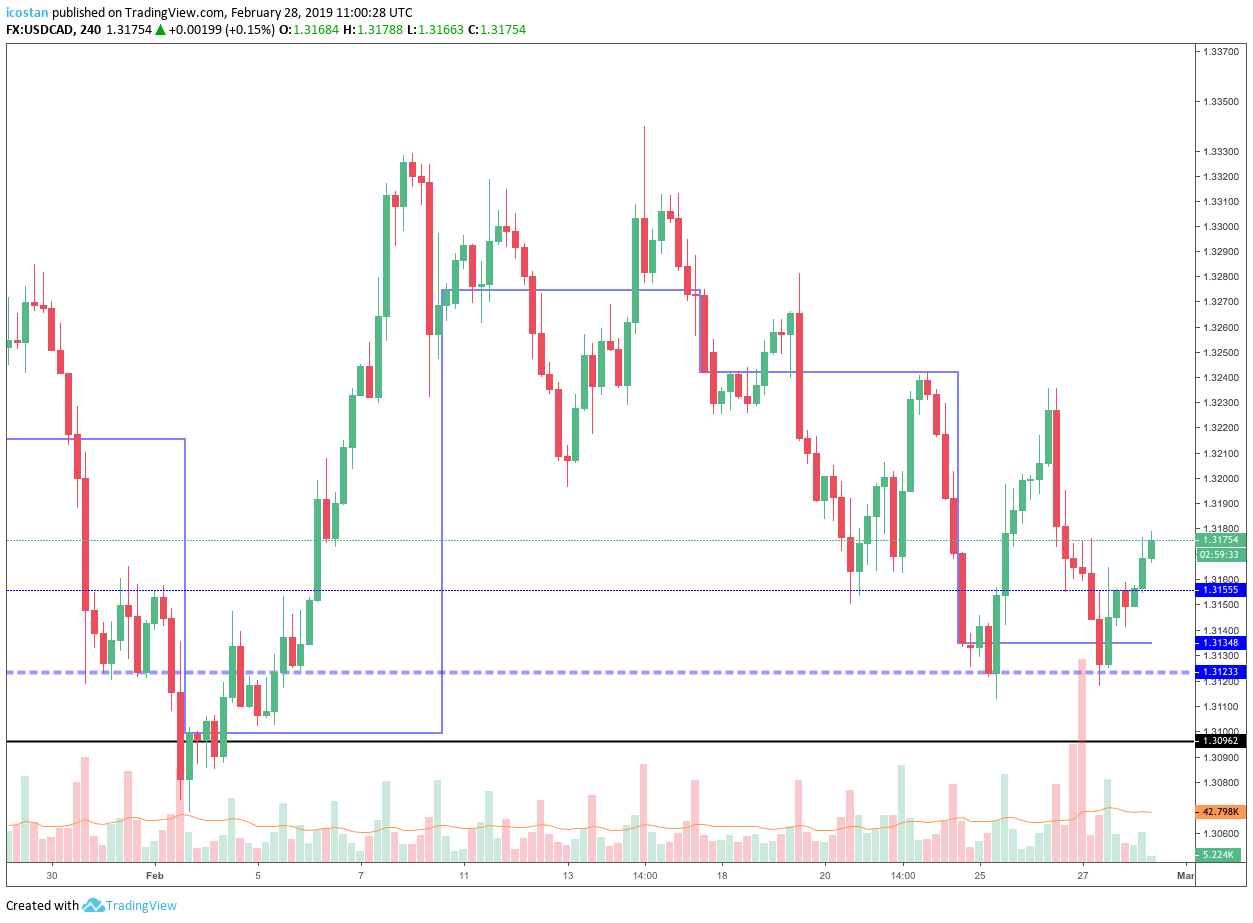
- history mode - to display all weekly/monthly history close prices (2nd image)
Close prices are great deal to me, especially on higher timeframes and I see the price bouncing off these close lines again and again.
See how last month’s close (ticker blue line) provides nice resistance and the price forms a double top then consolidates under last week’s close line (thiner blue line).
It also works on intraday charts and displays history close prices, see how last month’s close (ticker blue line) provides support over and over and also how price bounces off weekly’s close history prices (thiner blue line).
Trade long and prosper!